The Story: A Distracted Student
Rosie is a departmentalized fifth-grade science teacher who has built her classroom around hands-on learning opportunities for her students. Because she believes so strongly in the importance of her subject, she’s been working to find even more ways to get the most from the students, especially those with special needs, in her engaging class. As a result of her unique class, Rosie observes different needs from her students than her colleagues so she is able to plan appropriate adaptations for her class that may not be needed in other settings.
One student in particular, Oliver, has difficulty staying engaged during learning because he is easily distracted by others. This looks like Oliver often getting in trouble, not completing hands-on assignments, and getting lower test grades. To get the most from Oliver, Rosie knows she needs to put an accommodation in place but given the busy nature of her classroom, she needs to be certain her efforts are working.
The Context: Data Makes Your Time Count
Nobody, especially a busy hardworking educator, wants to waste time or energy on fruitless efforts. Collecting data is the best way to verify which actions and adaptations work best for each student (not to mention, data collection in special education is required by law).
What’s the best data to collect? With six types to consider, Rosie might collect the following:
-
- Duration data to determine the amount of time Oliver works without distraction or how long his distraction lasts.
- Frequency data to identify how many times Oliver gets distracted in a class period or how often Oliver completes an assignment.
- Accuracy data to see if the accommodation changes his performance on tasks and tests.
The data Rosie chooses to collect depends on both Oliver’s needs and the accommodations she plans to implement. And, because she’s implementing the accommodation in her own room and not as a part of the entire IEP team, she can also select a method that fits well in her classroom.
The Point: Verify Adaptations are Working
To verify an adaptation’s impact, follow a process that:
- Identifies the presence of a need
- Determines data to be collected
- Collects baseline data
- Collects implementation data
- Proves or revises the effectiveness of your effort
The Story Continues: Time Well Spent
Rosie decides she will start with two accommodations to support Oliver: B6-Seat student to reduce distractions and B5-Seat student close to a positive role model.
To verify how well the adaptations work, Rosie decides to collect data on the number of redirections (frequency) she provides to Oliver each period. Collecting this data type is a fluid activity for Rosie, as she always circulates the classroom while her students are working.
Before implementing the accommodations, Rosie begins by collecting baseline data that shows 4.7 redirections each period when averaged per day for a week. She then meets with Oliver to explain the accommodations and how she believes they will help him to focus during class.
After implementation, Rosie collects the same frequency data and notices that her redirections dropped to 1.5 per class as a weekly average! Rosie knows the accommodations she’s using to support Oliver are working so she shares her data with the rest of the IEP team! Even more impressive is that she notices Oliver’s grade in her class has also improved because of his ability to complete assignments.
Be Action Driven!
- Research and explore the types of data you may collect.
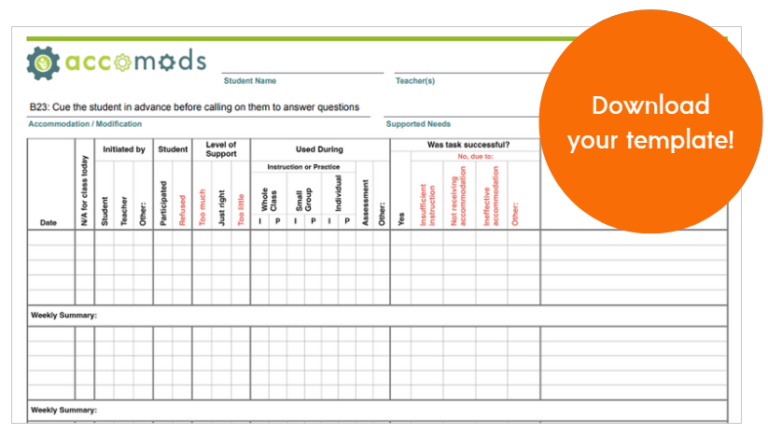
- Jump into Accomods and explore our new Adaptation Data Form. Don’t have an account? Get one here!
- Learn more about the adaptations data collection process.
- Share your data with others!

